Graph
Generate an interactive HTML dependency graph for your monorepo workspace. The output file is saved to.xflutter-cli/graph/graph.html and visualises all applications and shared packages with their relationships. Must be run from the workspace root.xflutter_cli graphGenerated Graph
The CLI generates a D3.js powered interactive HTML file. Every node represents an application or a package. Arrows show which module depends on which.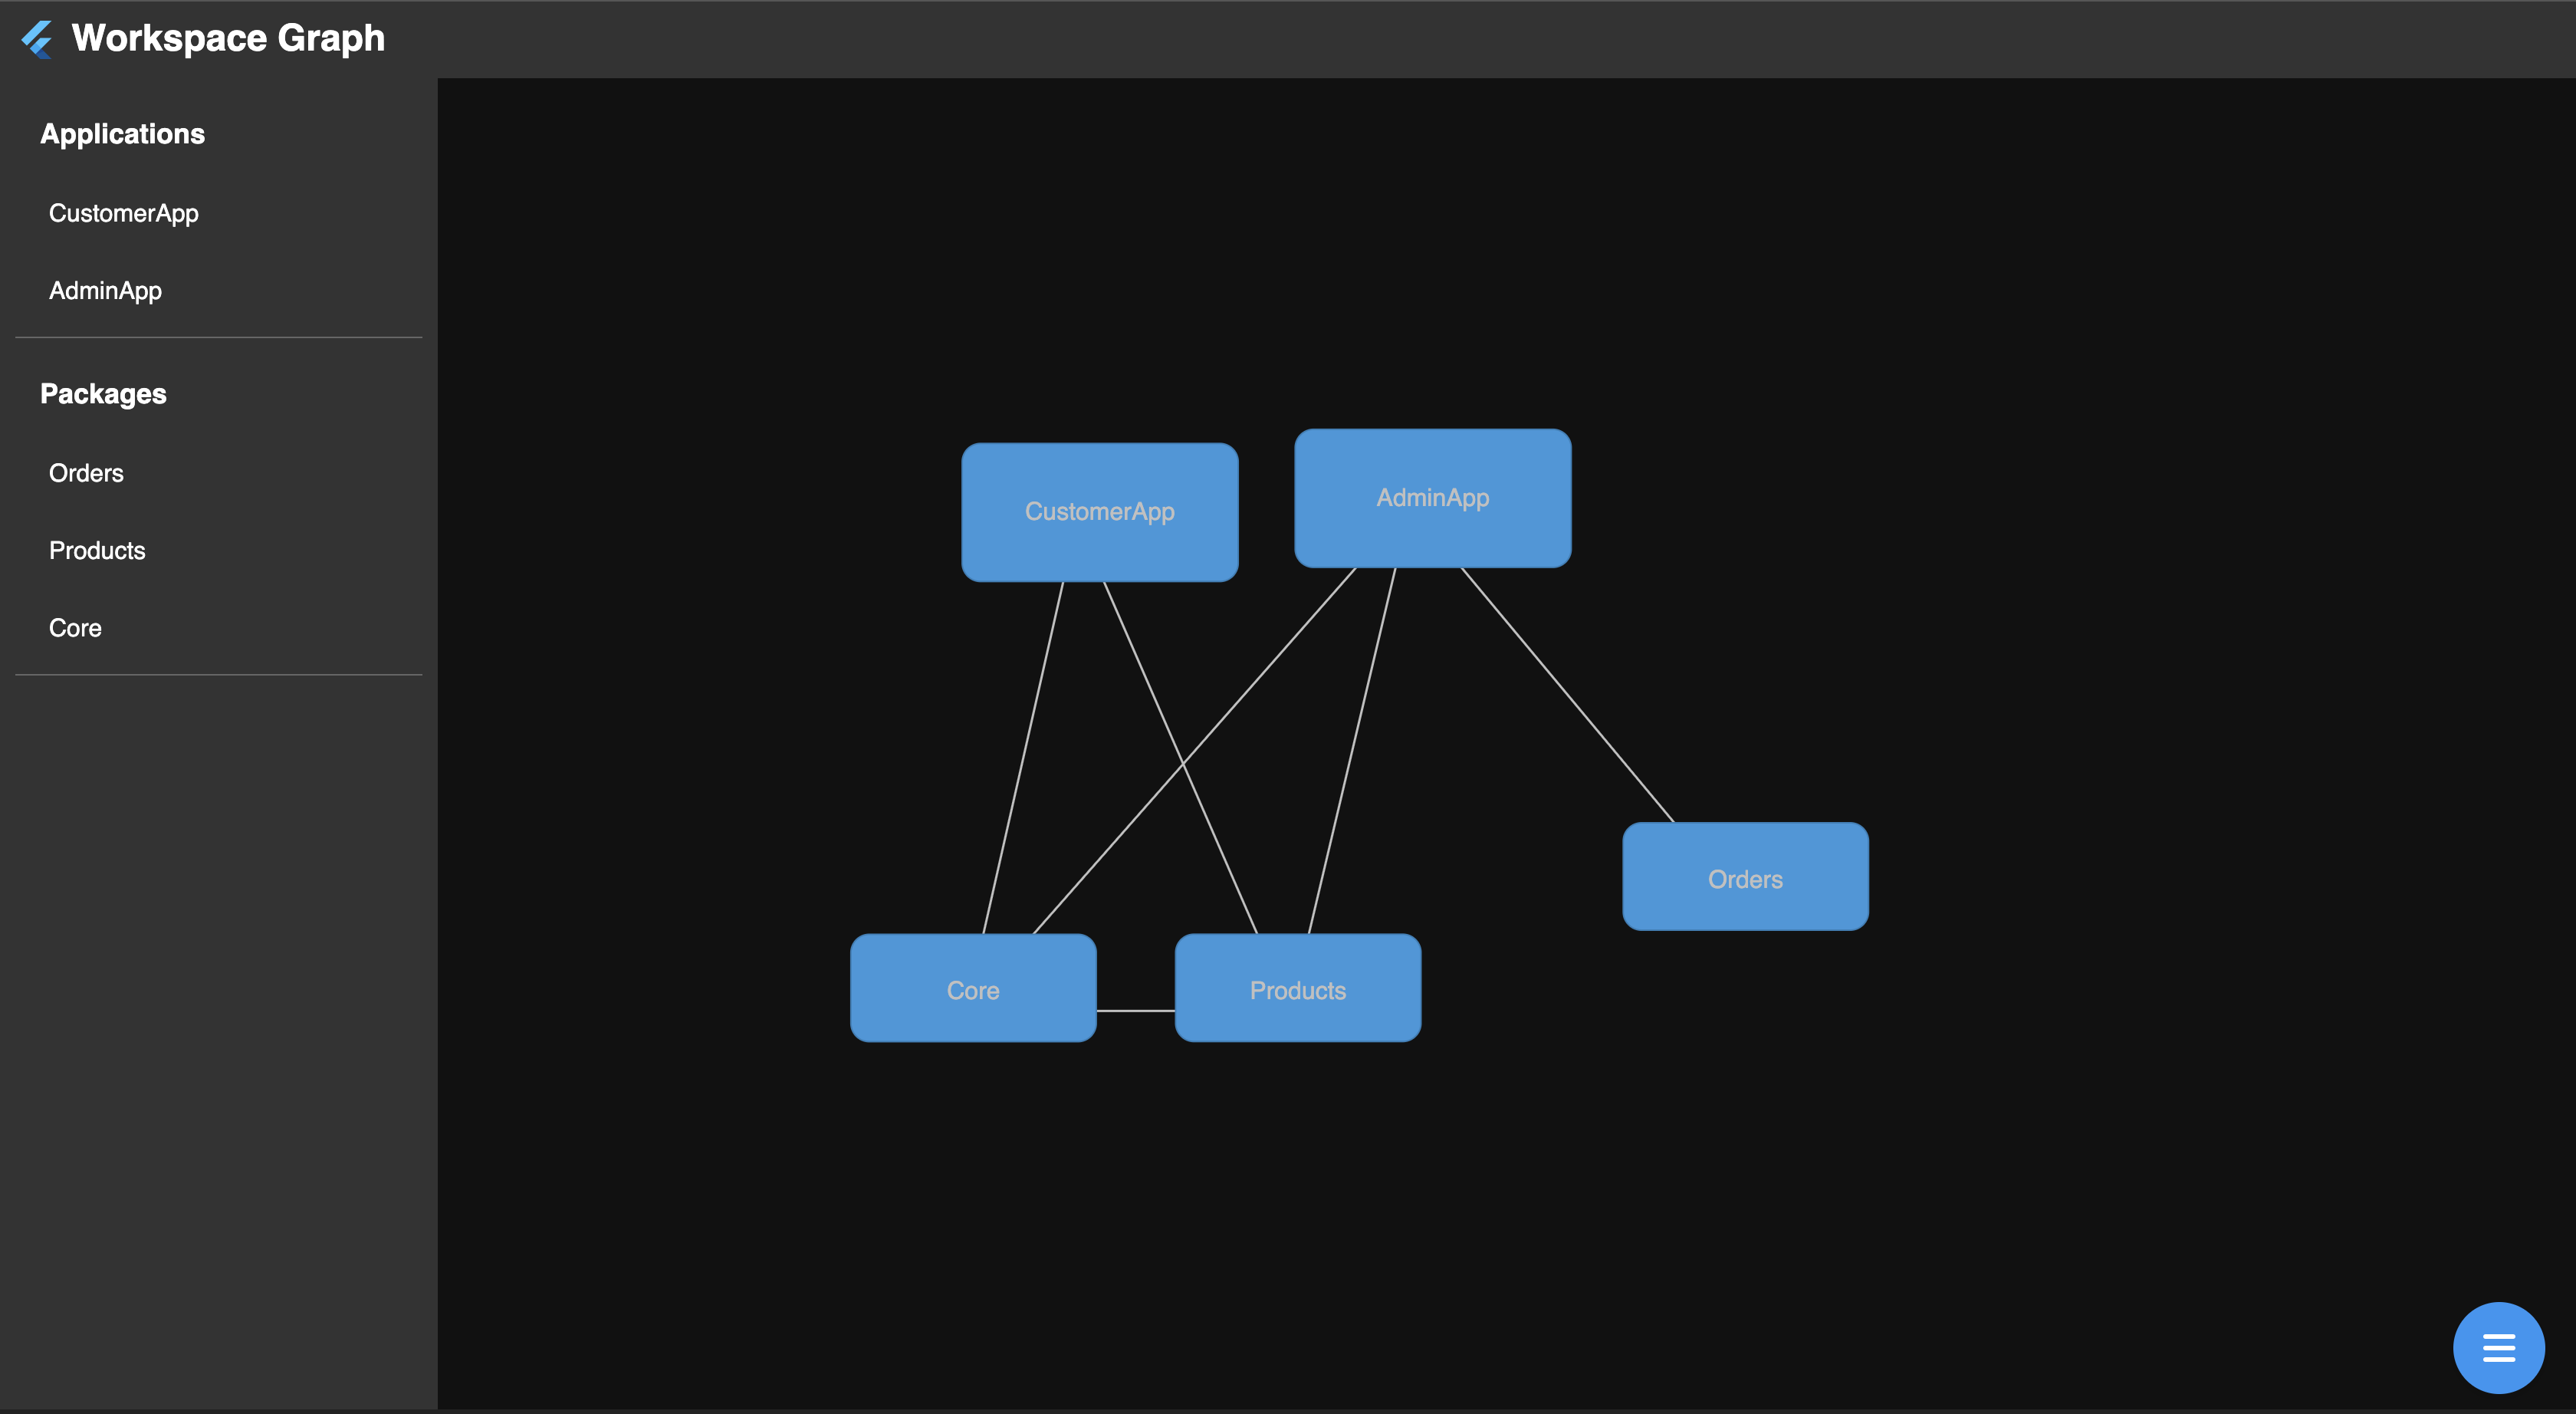
Hover to explore relationships
Hover over any node in the graph or any item in the sidebar to instantly highlight its dependency chain. Unrelated nodes are dimmed so you can focus on what matters.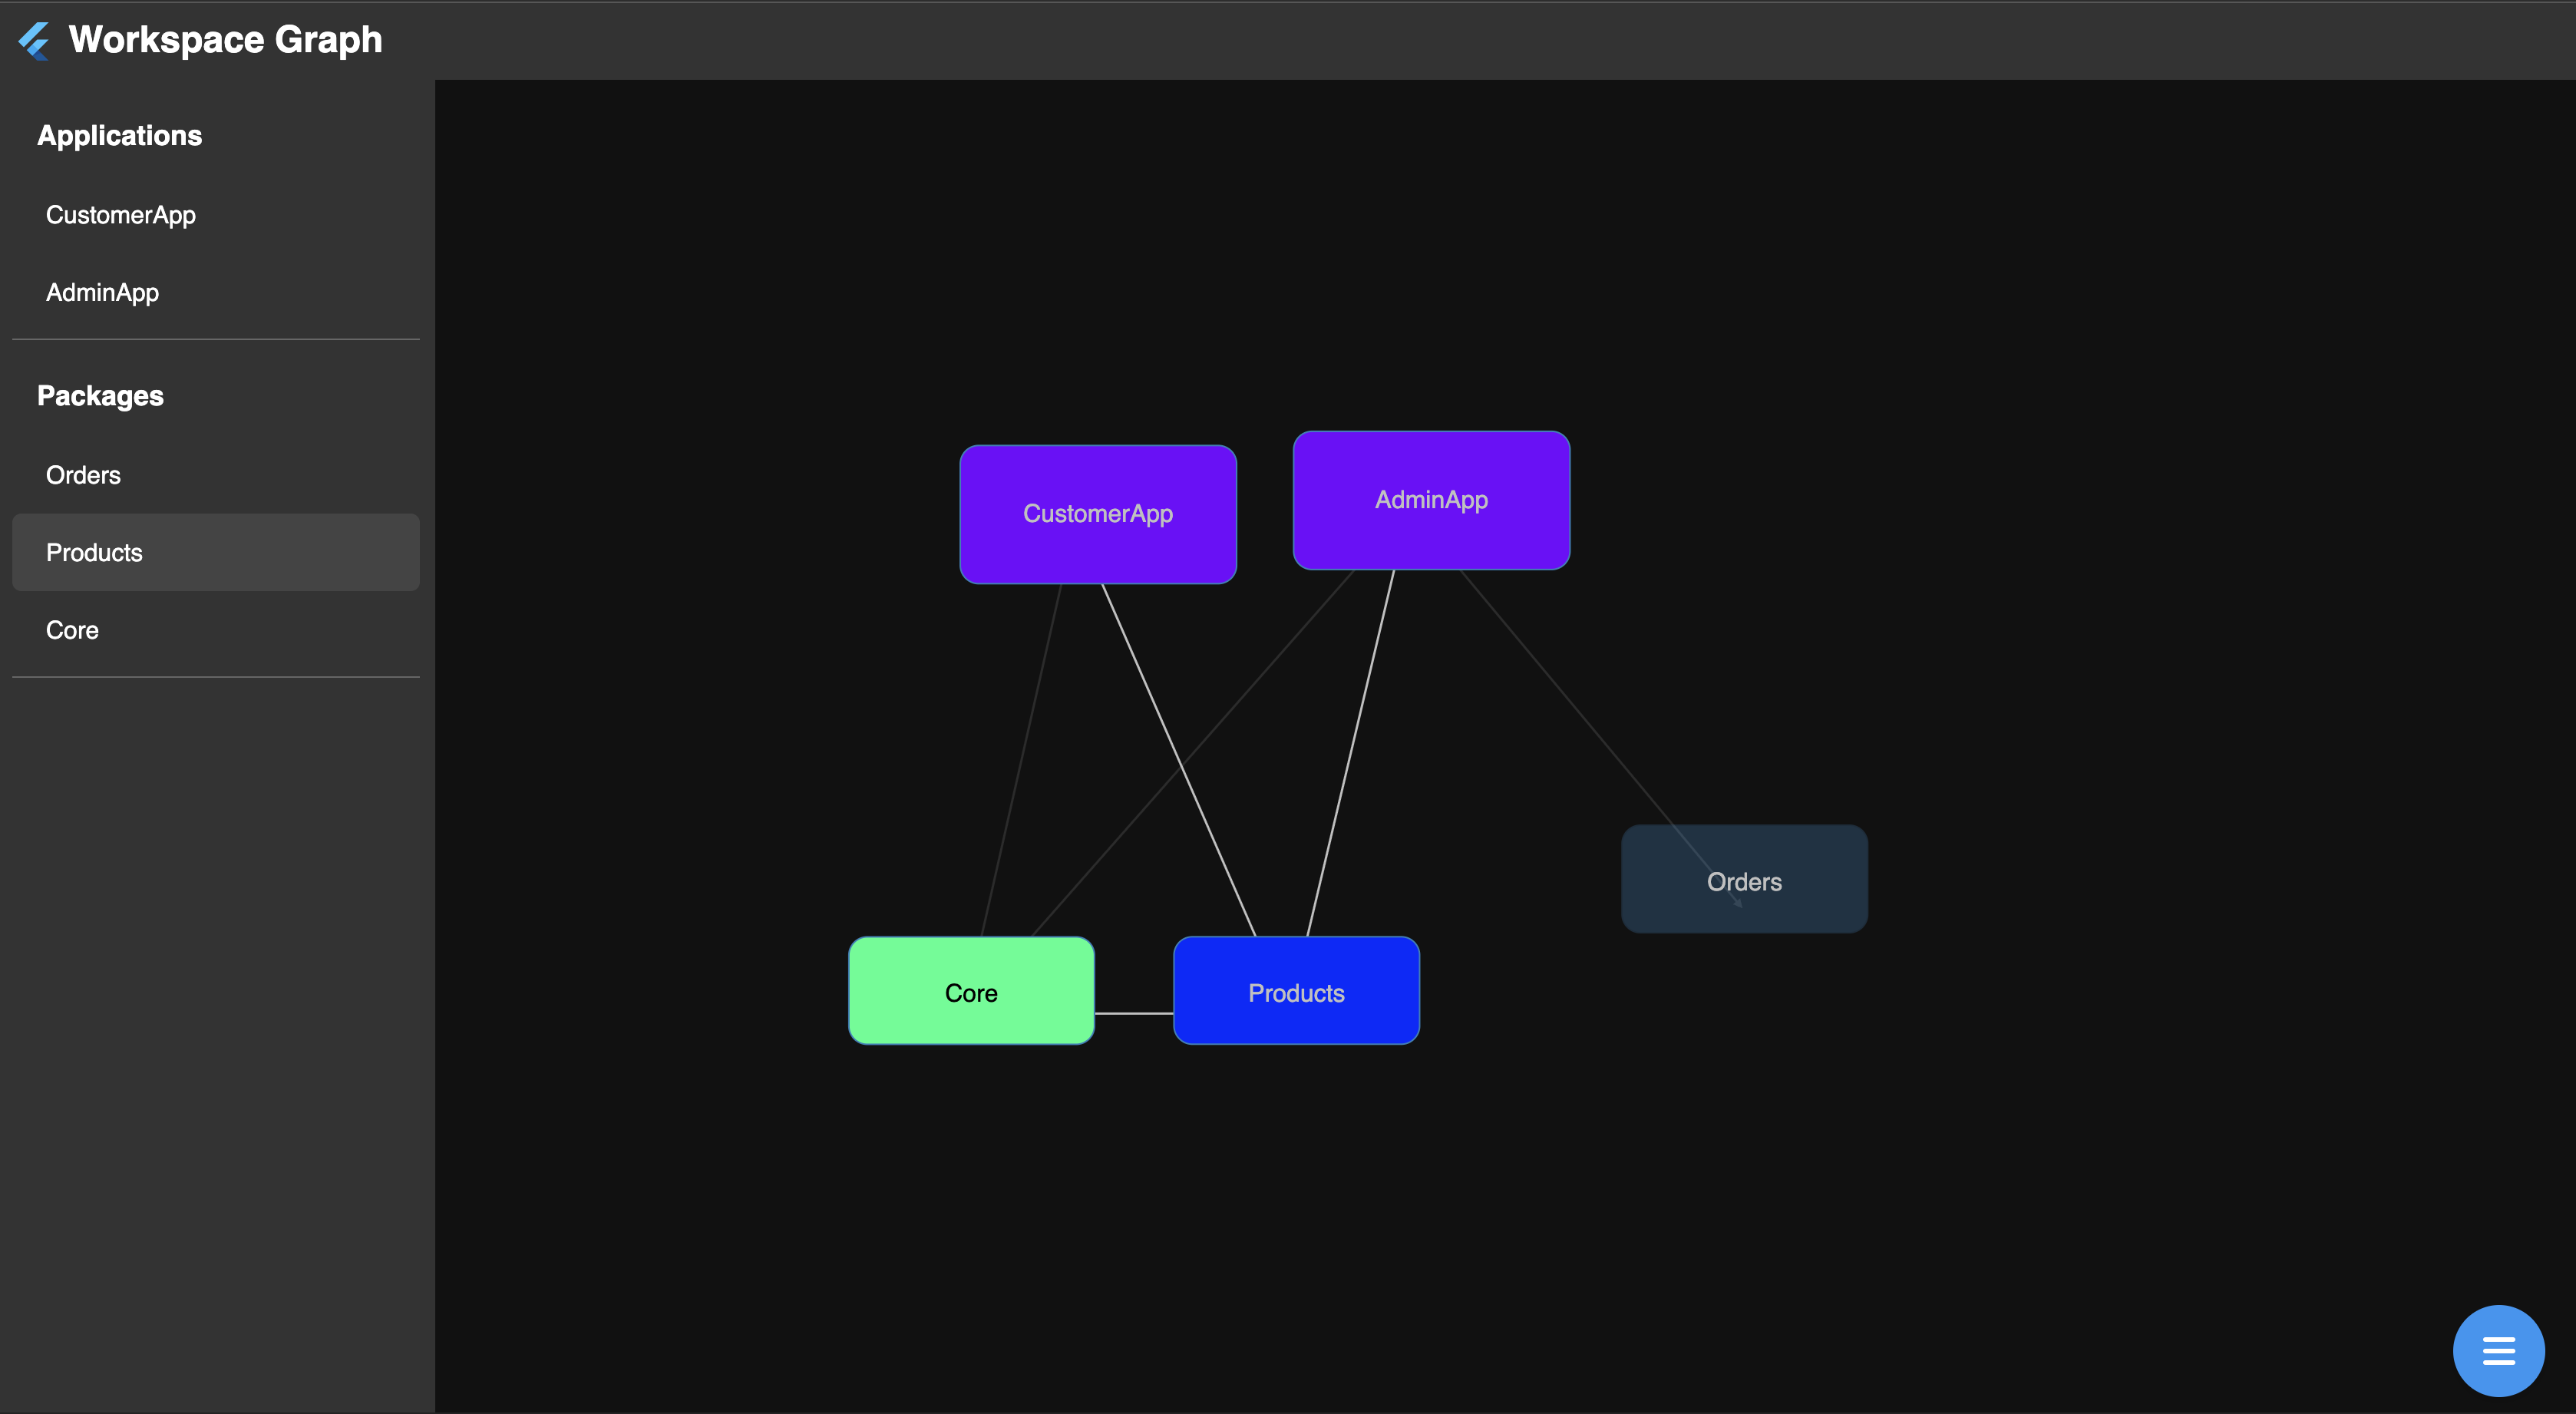
Color legend:
- BlueThe hovered / selected module
- PurpleModules that depend on the selected module
- GreenModules that the selected module depends on